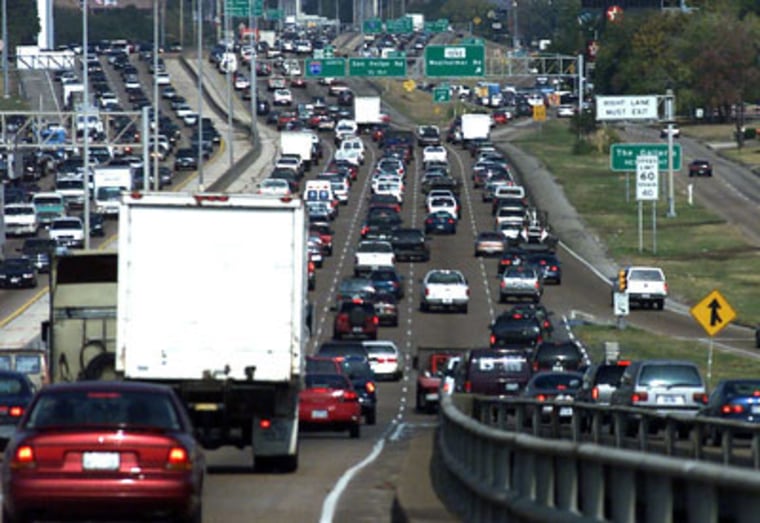
As cities sprawl, commuting in America just keeps getting worse.
The average travel time to work in the U.S. is growing steadily. From 1980 to 1990, it increased 40 seconds, from 21.7 minutes to 22.4 minutes for a one-way trip. In the next decade it increased by about three minutes to 25.5, according to Commuting in America by Alan Pisarski, a 2006 study published by the Transportation Research Board.
Even more worrisome trends are emerging in major urban areas. Back in 1990, only in New York state did more than 10 percent of workers travel over 60 minutes to get to work. By 2000, New Jersey, Maryland and Illinois had acquired the same dubious distinction, and California was coming close. (Length-of-commute measurements include both those in cars and those using public transport, which on average takes longer and which is much more common in places like New York.)
In 2003 the U.S. Census felt it necessary to coin the term “extreme commuting” to describe trips of over 90 minutes. Today, more than 10 million workers travel more than 60 minutes each way, and around 3.3 million travel 90 minutes or more.
These increases are taking place as commuters try new tactics to avoid congestion. More and more workers carpool, and more and more leave for work before 6:30 a.m. or after 9 a.m., according to Commuting in America. Likewise, so-called reverse commutes — from a city to a suburb — are on the rise.
They accounted for a 20 percent share of the growth in commuting between 1990 and 2000, while traditional suburb-to-city commutes accounted for only 14 percent of growth. Suburb-to-suburb commuting is also on the rise, now accounting for 46 percent of metropolitan commuting.
All of these trends should be taking pressure off the roadways, but instead traffic congestion is getting more intense. The Texas Transportation Institute measures big-city traffic jams by dividing extra travel time for peak period travel (from 6 to 9 a.m. and 4 to 7 p.m.) by the number of travelers who begin trips during those hours. In its most recent Urban Mobility Report, the institute estimates that the average commuter spent 47 hours stuck in traffic in cities with more than 1 million people. In cities of over 3 million people, it’s 61 hours.
California wins the award for worst traffic jams, with Los Angeles and the San Francisco metro area coming in first and second. The Riverside-San Bernardino area tied Orlando, Fla., for ninth place. In Los Angeles, the average annual delay per traveler is 93 hours.
That’s a lot of talk radio for even the most enthusiastic listener. Meanwhile more than just time is being wasted. The report estimates that traffic delays cost $63.1 billion a year, and waste more than 2.3 billion gallons of fuel.
Relief is not immediately at hand. David Schrank, author of the Urban Mobility Report, says that despite the escalating problem, commuters aren’t changing their habits very rapidly. A serious reduction in congestion will require more roads, more public transportation and more efficient operation of both, says the Urban Mobility Report. But even if cities and states have the political will to make changes and the money to execute them, major improvements will take 10 to 15 years.
