Laser scans of Earth's land surface taken from aircraft have now yielded the most comprehensive before-and-after picture of an earthquake yet, scientists revealed Thursday.
These kinds of scans before and after large quakes may help reveal where exactly the quakes ruptured the Earth down to a scale of just a few inches, which may help experts prepare for the hazards of such quakes, researchers said.
Scientists from the United States, Mexico and China working with the National Center for Airborne Laser Mapping flew over the area struck by the magnitude-7.2 El Mayor-Cucapah earthquake in northern Mexico on April 4, 2010. The quake produced a 74-mile-long (120 kilometer) rupture through Baja California, Mexico.

This earthquake did not happen on a major fault, like the San Andreas, but ran through a series of smaller faults in the Earth's crust. Over the past century, most of the damaging earthquakes on continents have arisen from such multiple-fault ruptures.
"We can recognize their activity from how they disrupt the landscape, but we don't have a good way of assessing the potential size of earthquakes they produce, because they tend to rupture together with other, nearby faults in a complicated way," said researcher Michael Oskin, a geologist at the University of California, Davis. "These types of earthquakes can be especially dangerous if they occur near an urban area that is not well prepared."
Before and after
The research team scanned the area with LIDAR, or Light Detection and Ranging, which bounces a stream of laser pulses off the ground. New, airborne LIDAR equipment can measure surface features to within a few inches.
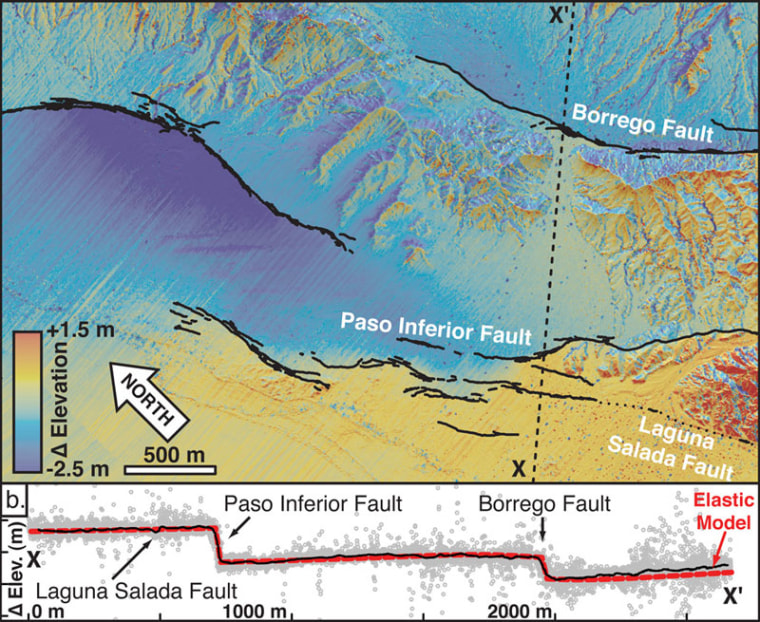
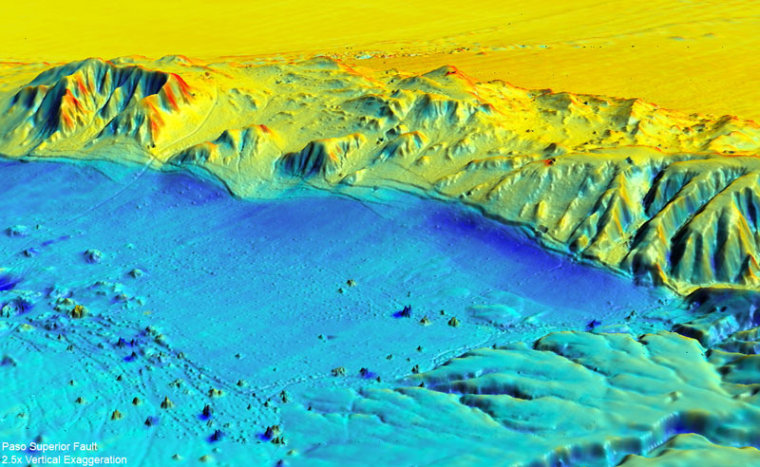
The scientists finished a detailed scan over about 140 square miles (360 square km) in less than three days. With this data they were able to discover and map the several faults, including a previously unknown one. Since the Mexican government scanned this area with LIDAR back in 2006, they were also able to compare the old and new data to identify just how the many faults in the area reacted.
"This gives new insight into how faults link together to produce large earthquakes, and how geologic structures incrementally grow these events — for example, folding of rocks and growth of topography and basins around faults," Oskin told OurAmazingPlanet.
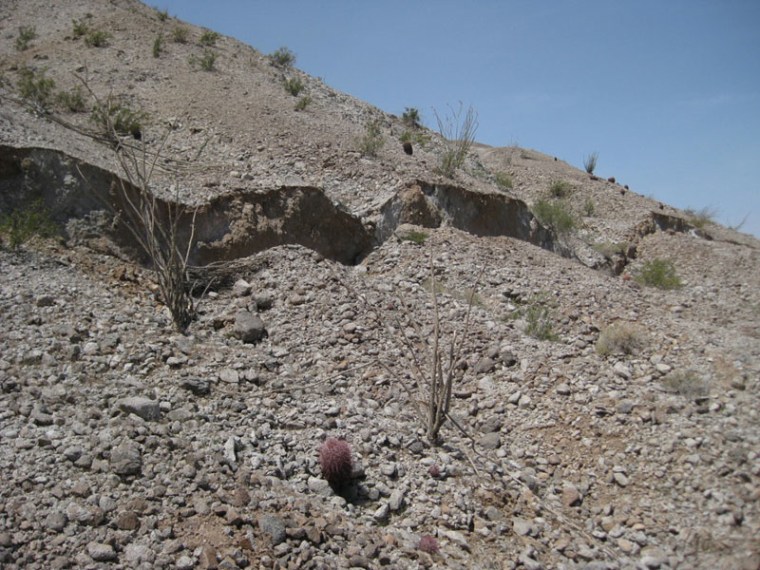
The laser scan revealed warping of the ground surface next to the faults that previously could not easily be detected. For example, it revealed folding above the previously unknown Indiviso fault running beneath agricultural fields in the floodplain of the Colorado River. "This would be very hard to see in the field," Oskin said.
Using a virtual-reality facility at the UC-Davis, the research team handled and viewed data from the survey to see exactly where the ground moved and by how much.
"We can immerse ourselves into the 3-D data set, down to the individual point measurements — all 3.6 billion of them for the post-earthquake data set," Oskin said.

The scans revealed how seven of these small faults came together to cause a major earthquake.
"We can learn so much about how earthquakes work by studying fresh fault ruptures," Oskin said. "In this case, we have learned a great deal about how the rocks surrounding faults deform, which will give us better insight into how faults link together."
Scanning the San Andreas
Airborne LIDAR scans have also been conducted of the San Andreas system and other active faults in the western United States.
"We are already using these data to better document the prehistoric record of activity on these faults," Oskin said. "When an earthquake happens in one of these areas, there will be a new scan conducted and a comparison made. This comparison will be even more revealing than the one we published, because both data sets will be high resolution. In our case, the pre-earthquake data set was relatively low resolution."
Future work can also model the interactions of the various faults that slipped in the 2010 El Mayor-Cucapah earthquake, "to develop better projections of how future, complex multi-fault ruptures may occur," Oskin added.
The scientists detail their findings in Friday's issue of the journal Science.
