A new analysis of the March 11, 2011, tsunami that devastated Japan's east coast could improve flooding forecasts and help prevent a similar disaster from occurring in the future.
Despite an extraordinary level of preparedness by the Japanese, the massive tsunami that followed the magnitude 9.0 earthquake caused more than 90 percent of the almost 20,000 fatalities from the disaster.
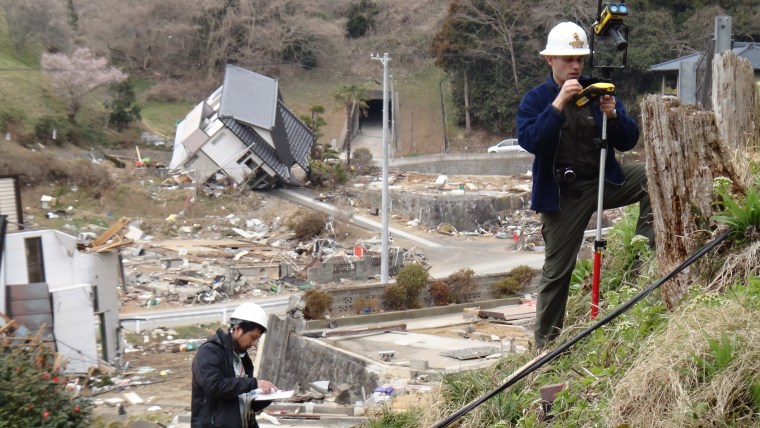
Using eyewitness video and laser scanners from atop the highest buildings that surveyed the tsunami, a team of researchers has mapped the tsunami's height and flood zone to learn more about the flow of the devastating currents.
The work could improve tsunami warnings by producing flooding forecasts that influence future evacuation plans and building designs in Japan and in other areas of the world susceptible to tsunamis, according to the study team.
"The ultimate goal is to save lives," said study team member Hermann Fritz of Georgia Tech. "In order to do so, we have to have a better understanding of what worked and didn't work."
Fritz led a reconnaissance team surveying the impact of the tsunami on a fishing town in Kesennuma Bay, where 1,500 people perished. The bay has been hit by tsunamis in 1896, 1933, 1960 and 2010. The coastal structures and other mitigation measures on the coast were designed based on conservative, historic high-water marks, rather than probable maximum tsunamis. [ Pictures: Japan Earthquake & Tsunami ]
From atop buildings where witnesses gathered during the tsunami, Fritz and his team used lasers to scan the port and bay entrance, creating a three-dimensional, topographic model — called a hydrograph — of the flood zone.
Using this data, they reconstructed eyewitness videos to determine the heights and flow of the tsunami. They determined that the tsunami reached a maximum height of 29.5 feet (9 meters), followed by outflow currents of 36 feet per second (11 meters per second) less than 10 minutes after the main peak hit — a speed which Fritz says is impossible to survive or navigate by vessels.
"What we can learn from the hydrograph is confirmation that the water goes out first, drawing down to more than negative 3 meters (10 feet) on the landward side of the trench, which can make vessels hit ground inside harbors," Fritz said. "During the subsequent arrival of the main tsunami wave, the water rushing back in changed the water level by 40 feet (12 m), engulfing the entire city in 12 minutes."
Understanding tsunami impacts will help prepare for future disasters — whether it's designing buildings high enough to serve as vertical evacuation points or sea walls and breakwaters strong enough to control the flow of water.
Follow OurAmazingPlanet for the latest in Earth science and exploration news on Twitter @OAPlanet and on Facebook.
