This week, a new set of state polls from Gallup showed President Donald Trump’s job approval numbers are very uneven and hold some deep challenges, but a deeper look at the numbers reveals clues about potential shifts in the electorate.
On the most basic level the Gallup data, based on daily tracking polls from Jan. 20 through June 30, show Trump’s job approval is “underwater” (with higher “disapprove” than “approve” numbers) in 31 of the 50 states. His approval number is only 50 percent or higher in 17 states.
But going deeper than Trump’s broad struggles, the numbers in specific states show how the president’s first six months seem to have locked down support in some places and perhaps changed the landscape in others.
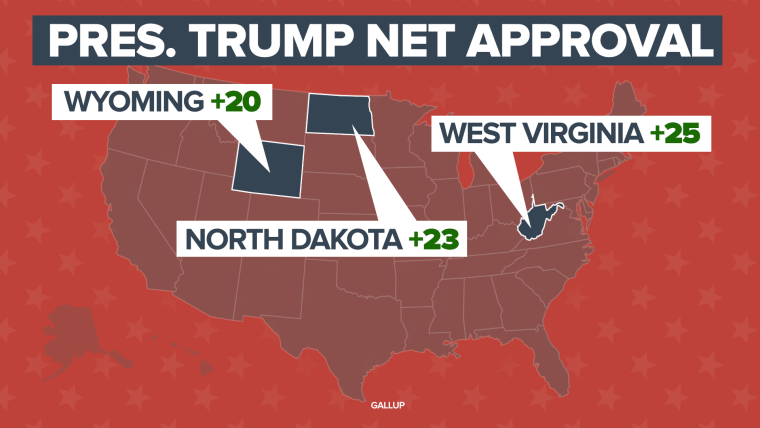
Rock-Solid Trump Country — There are three states in the Gallup polling that stand apart from the rest for their Trump support: North Dakota, West Virginia and Wyoming. In each state, the president’s job approval is 20 points or more above his job disapproval.

What do those states have in common, beyond a huge vote for Trump in November (he captured more than 60 percent of the vote in each)? Several things: All are rural. And all are big on fossil fuel production and not big on racial and ethnic diversity. The three are more than 84 percent white and non-Hispanic. Wyoming and West Virginia are first and second in terms of coal production. And North Dakota is the number two state in terms of crude oil production.
Put those pieces together and you have the underpinnings of true Trump country.
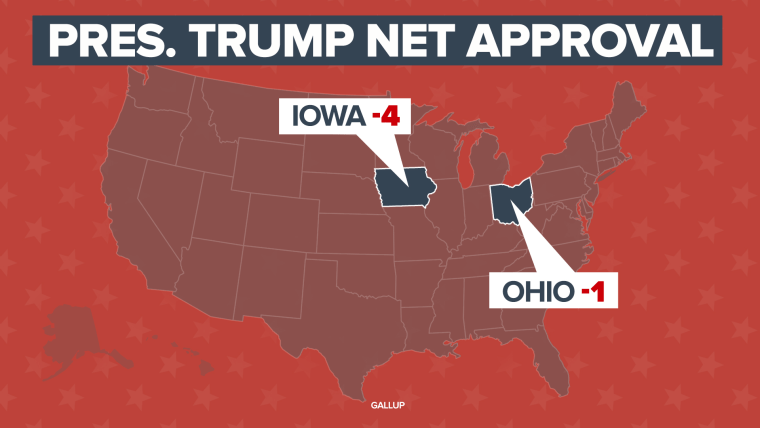
The Flips That May Be Holding — Trump won in November by carrying reliably Republican states and then flipping others that had voted for Barack Obama twice, including Ohio and Iowa. Those two states still look pretty good for Trump in the Gallup data. He’s underwater in them, but not by a lot and his job approval rating is 45 percent or more. Furthermore, Trump’s stronger approval number is coming in tandem with a disapproval number that is under 50 percent.

Trump’s better standing in these states fits with their recent political history. Both have looked like swing states since 2000 and have voted for Republican presidential candidates besides Trump. Ohio voted for George W. Bush twice and Iowa voted for him in 2004. These were the easiest for flips for Trump in the Midwest, and the fact that he’s holding his own in them is a good sign for him.
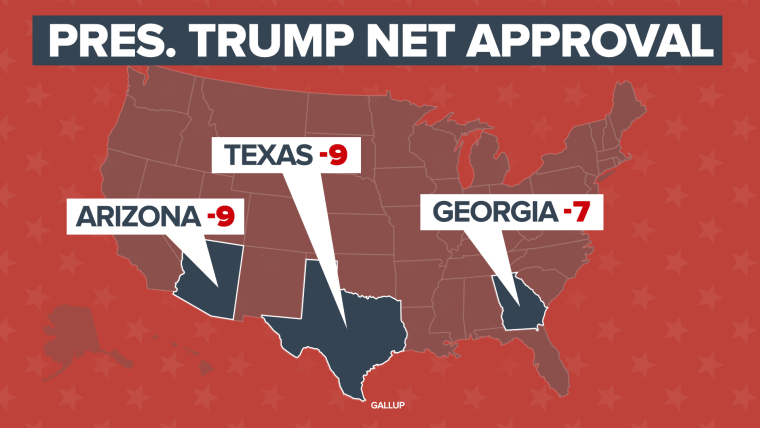
The Solids That Look Weaker — The Gallup numbers include a big warning sign for Trump in states that have long been among the reddest parts of the Republican coalition: Texas, Arizona and Georgia. Republican presidential candidates have won all those states in every election since 2000. In each one Trump is at least 7 points underwater and his job disapproval number is at 50 percent or more.

These are remarkable figures when you compare them to the approval numbers out of Ohio and Iowa. The Republican president is doing worse in these solid Southern and Southwestern states than he is in the Midwestern battlegrounds.
So what’s happening here? These states are growing rapidly and diversifying racially and ethnically. The white non-Hispanic population of each is 55 percent or less, compared to a national figure of 61 percent. In Ohio and Iowa the white, non-Hispanic population is above 80 percent.
It’s very early and Gallup’s data comes from polling adults, not registered voters, but these numbers could signal the beginning of a geographic/demographic shift with serious political impacts.
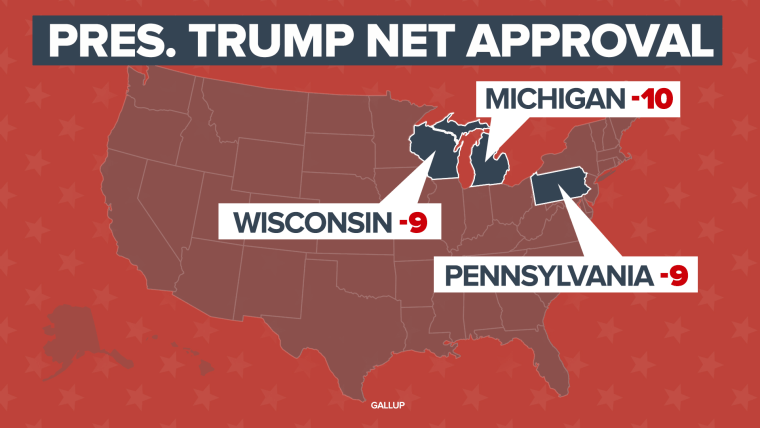
The Blue Wall Reassembling? — Trump ultimately won the presidency with narrow victories in three states: Pennsylvania, Michigan and Wisconsin. Democrats thought of the states as a great “blue wall” around the Great Lakes, but Trump smashed through and won where no Republican had won since 1988. Now, however, the Gallup data suggest some of the bricks may be falling back into place here. Trump is underwater by 9 or more points in the three states and is at 52 percent job disapproval in all of them.

Despite Trump’s strength with the blue-collar voters associated with these states, the three also have some factors working against the president. All have long histories as union strongholds and the kinds of big urban centers that are very sour on Trump in most polling, such as Philadelphia, Detroit, Milwaukee.
And Trump’s very narrow margins here in November — he won the three by a total of about 78,000 votes — mean they were never big supporters of him. His slip in the blue-wall numbers may be tied to his slide in the polls overall. Whatever the reason, without these states in his corner, any shot at a second term would get much tougher for him.
Beyond any set of states, however, these numbers from Gallup bring to mind a phrase that journalists and analysts have been discussing for years: political realignment.
In 2016 the Trump campaign reshaped the political map and gave a Republican the most electoral votes since the 1988 presidential campaign. But Gallup’s state polls raise questions about how lasting those changes may be and they suggest the Trump presidency may have its own impact on the 2020 electoral map.
