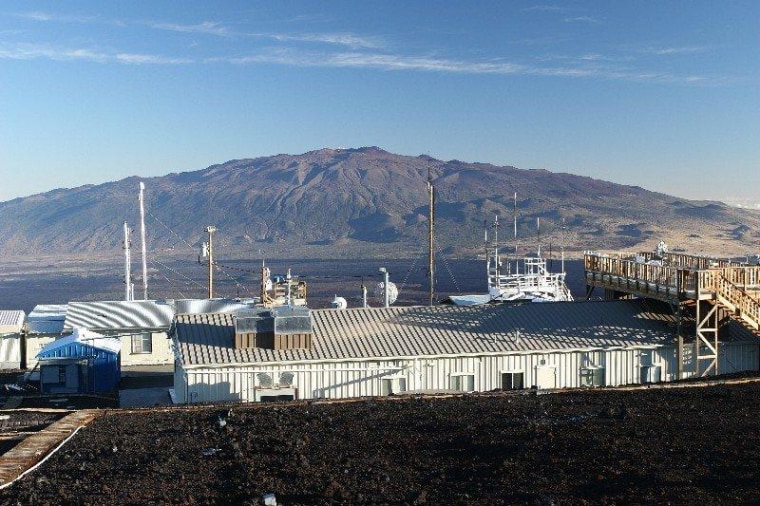
Any day now, the concentration of the greenhouse gas carbon dioxide sampled from the air wafting above a barren lava field in Hawaii could be above 400 parts per million (ppm), a level not seen since the Pliocene, between 3.2 and 5 million years ago.
Carbon dioxide levels were around 280 ppm when the Industrial Revolution got under way in the 18th century and humans started pumping greenhouse gases into the atmosphere from burning fossil fuels. Levels have continued to accelerate higher since then.
Hitting the 400 ppm milestone is symbolic to science and policy discussions about efforts to control global climate change, according Ralph Keeling, a geochemist at the Scripps Institution of Oceanography in La Jolla, Calif.
Human-forced global climate change is primarily driven by rising concentrations of carbon dioxide. Round numbers such as 350 ppm, 400 ppm and 450 ppm are discussed as targets for "safe" levels of the greenhouse gas - a level that will prevent the climate from spinning out of control, he explained.
"So crossing 400 represents, if you will, a lost opportunity," Keeling said.
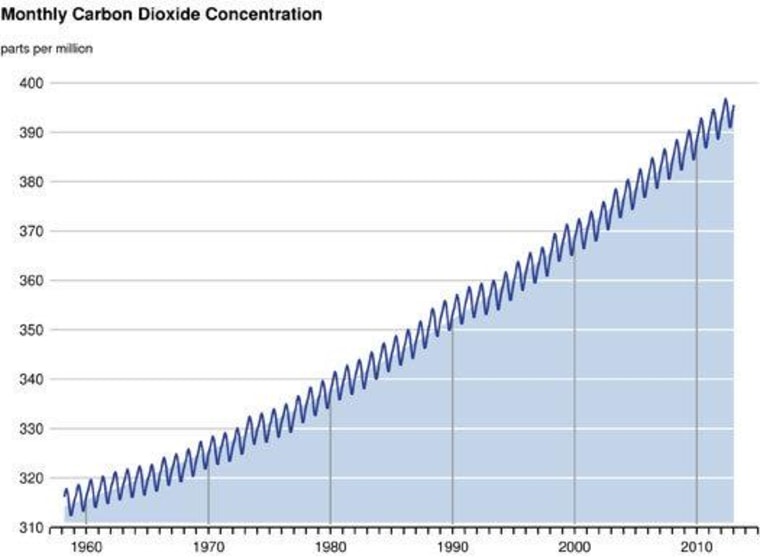
His late father, Charles David Keeling, a climate science pioneer at Scripps, began tracking levels of carbon dioxide in 1958 at the Mauna Loa Observatory. Concentrations then were 316 ppm.
Since then, levels have continued to step higher in a saw-tooth pattern, peaking each May before drifting lower as plants in the Northern Hemisphere absorb carbon dioxide to grow, then rising in the fall and winter.
Keeling Curve
The readings plotted on a graph show carbon dioxide concentrations curving sharply higher over time as humans burn more and more fossil fuels. The graph is known as the Keeling Curve.
Details from the curve, in fact, show the rate of increase continuing to accelerate, noted Pieter Tans, the senior scientist at the National Oceanic and Atmospheric Administration's Climate Monitoring and Diagnostic Lab, which oversees the Mauna Loa Observatory.

When David Keeling first started keeping records, the five-year average rate of change was 0.7 ppm. Today, it is 2 ppm, more than three times faster, he said.
"That is significant," Tans told NBC News. "We are just mostly talking about decreasing emissions. In practice, at least globally average, emissions are still accelerating and so is the rate of CO2 increase in the atmosphere."
But crossing 400 ppm in and of itself "doesn't mean anything in particular," Daniel Sarewitz, a sustainability scientist at Arizona State University, noted in an email to NBC News. "It's just another indicator of what we know full well already — that modern society is enormously dependent on fossil fuels for its well-being."
And that dependence on fossil fuels means concentrations of carbon dioxide will continue to climb for the foreseeable future, he added.
Watching for 400
To mark the crossing of 400 ppm, Scripps Institution of Oceanography launched a website and Twitter feed to provide daily readings from Mauna Loa. As of this writing, it stands at 399.29.
The hourly number fluctuates up and down depending on the atmospheric winds and, to a lesser extent, pockets air that upwell from lower on the island. Scientists calculate a daily average from hourly readings (when there's too much noise, a reading isn't produced). The daily numbers are then averaged to establish weekly, monthly and yearly numbers to be plotted on the graph.
From a scientific point of view, the monthly number matters the most, said Ralph Keeling, who took over the record keeping from his father. It is unlikely that this May will actually have an average above 400 ppm. The month is already a few days old and the threshold hasn't been crossed yet. The peak is typically the middle of the month.
There is, however, a better-than 50-50 chance that at least one daily reading above 400 will be recorded in the next few weeks, he said.
"Of course, we might go the whole month without it, but I'd be very surprised if we don't creep up over 400 next May and in a matter of a couple years, even the trough in the cycle will climb over 400, so it will be very hard to find any air that is below 400," he added.
How high concentrations will eventually go, he added, largely depends how willing humans are to forgo burning available reserves of fossil fuels and how many of those fuels actually exist.
"We are starting to move toward alternate fossil energy — non-conventional fossil fuels like tar sands and so forth," Keeling said. "And that’s a little troubling because it reflects our willingness to expand and use reserves of fossil fuels that probably ought to stay in the ground if we take this problem seriously."
John Roach is a contributing writer for NBC News. To learn more about him, visit his website.
