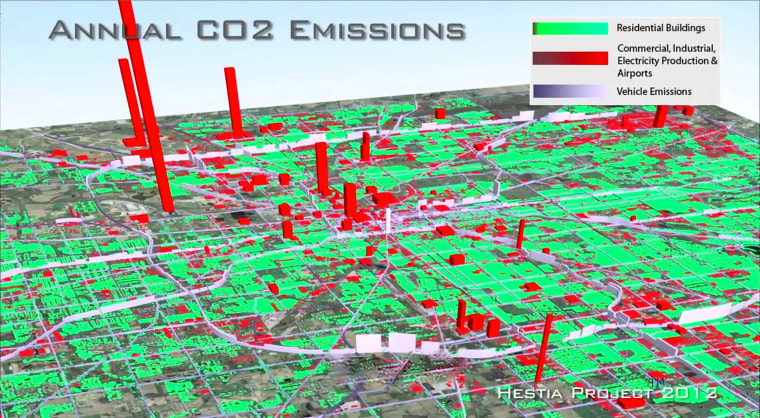
Humans are visual creatures. With that in mind, researchers have built a software tool that generates visualizations of estimated greenhouse gas emissions across city landscapes in a bid to help policymakers create effective laws to combat climate change.
The tool combines data from sources such as local air pollution reports, traffic counts, and tax assessor parcel information with a modeling system for quantifying carbon dioxide emissions at the level of individual buildings and street segments.
The data is presented with 3-D images that show where, when and how greenhouse gases from fossil fuel burning are generated. The format is intended to be simple for policymakers and members of the public to understand.
To date, Hestia, the Arizona State University tool named after the Greek goddess or hearth and home, has been applied to Indianapolis.
Perhaps not surprisingly, it shows the largest emitters of the greenhouse gas are the local airport and power plant. Hestia also shows the flux of emissions shifting from residential homes at night, roadways during commute times, and building during working hours.
The program is now being applied to Los Angeles and Phoenix. Ultimately, the team hopes to apply Hestia to all major cities across the United States, which account for nearly one-quarter of all global carbon dioxide emissions, they note in a press release.
A paper describing Hestia was published Oct. 9 in the journal Environmental Science and Technology.
– via Phys.org
John Roach is a contributing writer for NBC News Digital. To learn more about him, check out his website. For more of our Future of Technology series, watch the featured video below.
