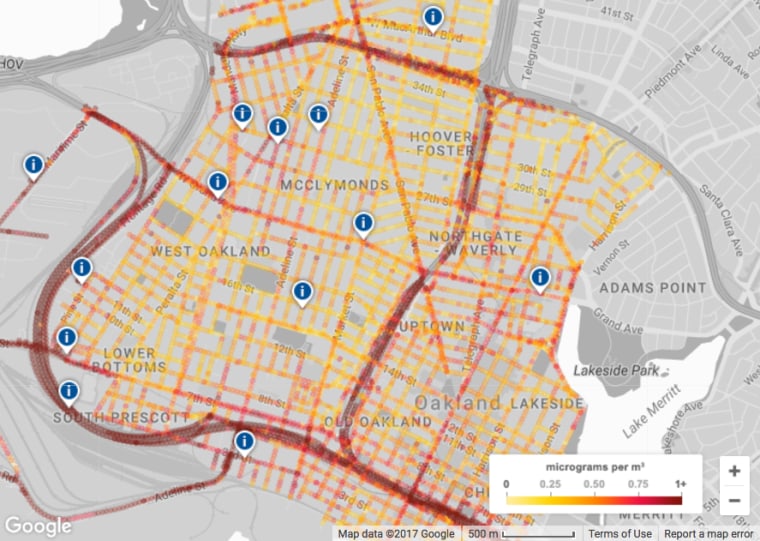
Air pollution is typically seen as a problem that affects entire cities or regions. But a new study shows that air quality can vary tremendously within a city — even block by block. The unexpected finding suggests that it might be possible for local authorities to pinpoint pollution hot spots that would otherwise go undetected — and help citizens avoid living in or traveling through those areas.
For the study, published last week in the journal of Environment Science & Technology, researchers from the Environmental Defense Fund (EDF), the University of Texas, and Aclima, an environmental sensor company, tracked two Google Street View cars rigged with air quality monitoring equipment as they drove throughout Oakland, Calif.
The vehicles measured the levels of black carbon, nitric oxide, and nitrogen dioxide in the air, collecting a total of 3 million data points during the yearlong study.
Related: If Elon Musk Can't Solve Our Traffic Woes, These Technologies Just Might
The results showed that traffic, time of day, and other variables create dramatic shifts in pollution levels near highways, bridges, and even fast food restaurants, adding to the "invisible threat” that has been linked to asthma, heart disease, and strokes.
The data was used to create detailed interactive maps featuring red, orange, and yellow dots to indicate levels of pollution at particular locations. The colors often shifted with traffic and at different times of the day, week, and year. Pollution levels varied as much as five times from block to block, says study co-author Dr. Steven Hamburg, chief scientist at the EDF.
“We have to understand the patterns better and we believe the Oakland data and the learnings from that and the subsequent cities we map will be able to highlight and illustrate exactly how to do that,” Hamburg says.
The study will soon expand to other cities. And Aclima, the San Francisco-based environmental tech company that equipped the cars, is exploring the possibility of putting its air-sampling systems on city buses and delivery trucks and at stationary locations in major cities to gather up-to-date air pollution measurements.
The data could be incorporated into Google Maps and other map apps so users could simply open their smartphones to know which hotspots to avoid. The information could make it possible for users to select a running route with clean air, for example, or focus their apartment searches to areas with low pollution.
"Doing the science is a means, not the goal," Hamburg says. “Our goal is to ensure that the data becomes available and is used and is affecting people in a real substantive and positive way.”
