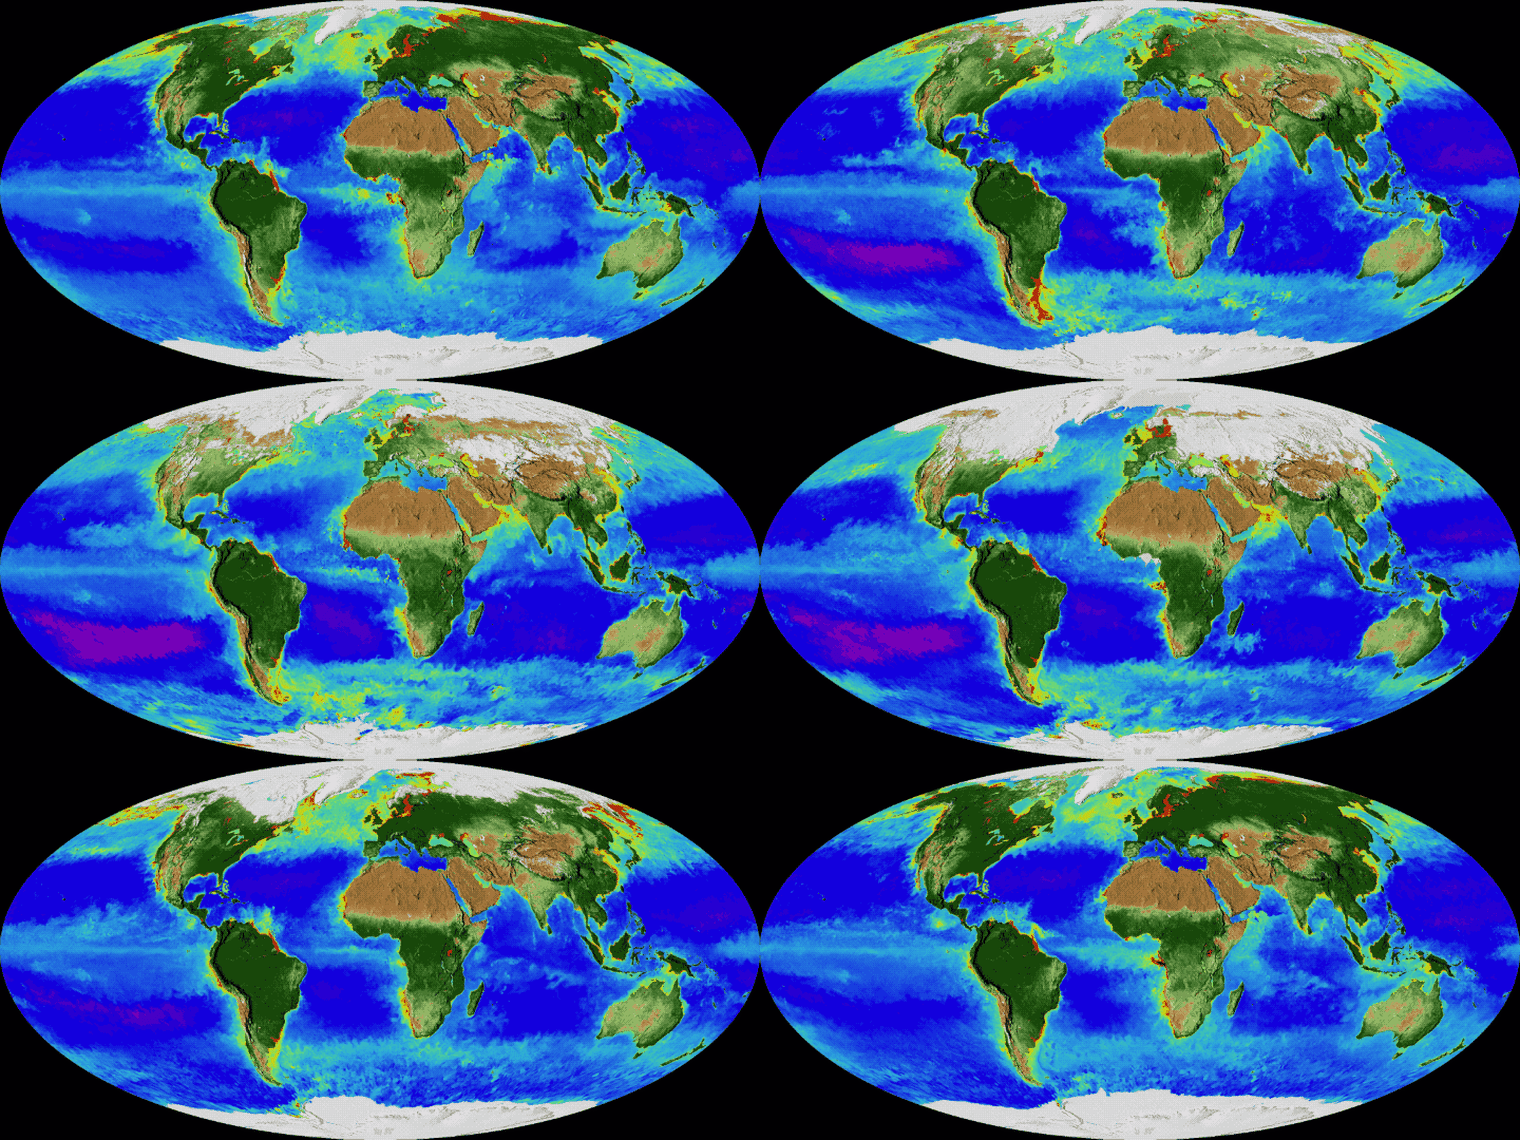
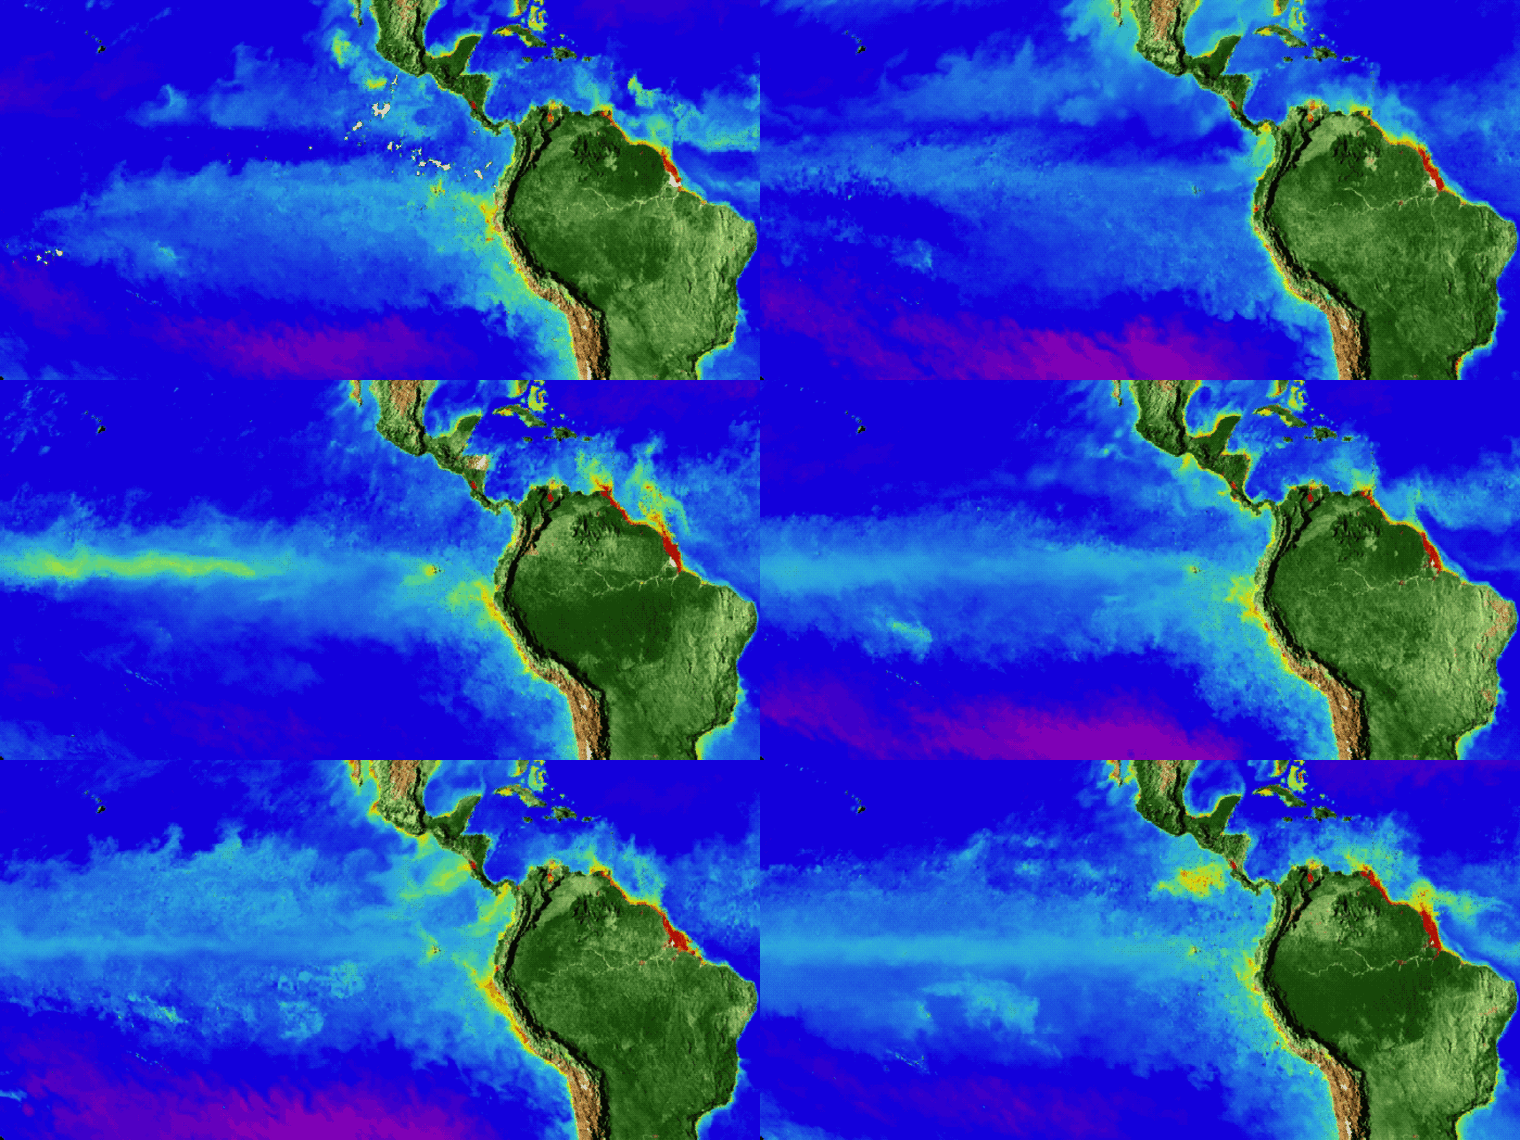
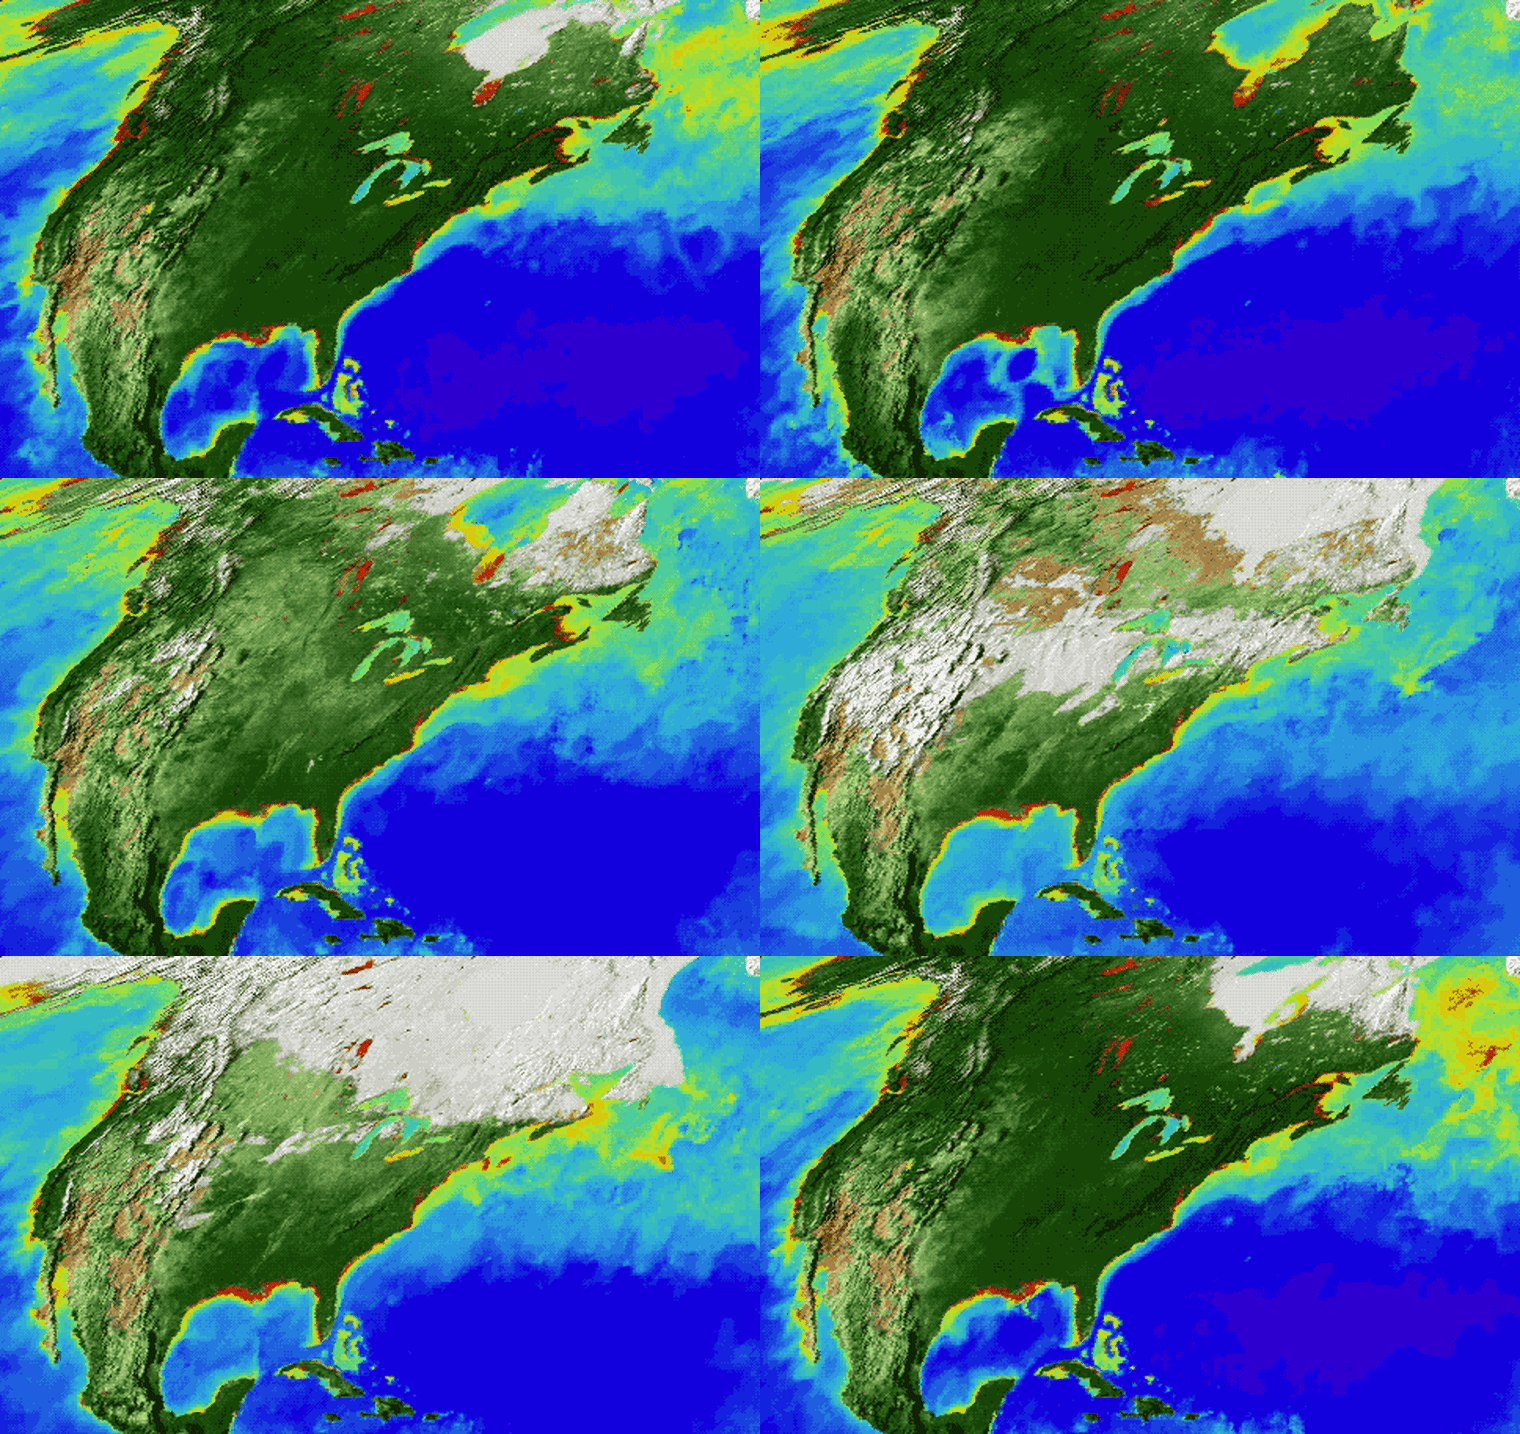
A cool new time-lapse video of Earth reveals how our planet has changed over the last two decades as NASA satellites continuously monitored the populations of plant life on land and in the oceans.
The video shows Earth "breathing" repetitiously as the seasons change throughout each year, with snow coverage on the North and South Poles periodically growing and shrinking while green regions of vegetation do the same.

Meanwhile, clouds of microscopic phytoplankton, a type of algae, bloom on the ocean's surface, where the tiny organisms turn water and carbon dioxide into oxygen and sugar as they bask in sunlight. [Earth's Plant Life from Space in Photos: NASA Satellite Images]
"These are incredibly evocative visualizations of our living planet," Gene Carl Feldman, an oceanographer at NASA's Goddard Space Flight Center in Greenbelt, Maryland, said in a statement. "That's the Earth, that is it breathing every single day, changing with the seasons, responding to the sun, to the changing winds, ocean currents and temperatures."

The visualization was created using data from Earth-observing satellites like NASA's Sea-viewing Wide Field-of-view Sensor (SeaWiFS) mission, which began collecting global ocean data in 1997, as well the space agency's Terra, Aqua and Suomi NPP weather satellites.
Seeing how plant life all around the planet has changed over the last 20 years can help scientists and researchers investigate how ecosystems are responding to changing environmental conditions, NASA officials said in the statement.
For example, studies have shown that rising sea surface temperatures have impeded growth of phytoplankton, which means that there are fewer organisms in the ocean to remove carbon dioxide, a greenhouse gas that is the main driver of climate change.
"The space-based view of life allows scientists to monitor crop, forest and fisheries health around the globe. But the space agency's scientists have also discovered long-term changes across continents and ocean basins," NASA officials said. "As NASA begins its third decade of global ocean and land measurements, these discoveries point to important questions about how ecosystems will respond to a changing climate and broad-scale changes in human interaction with the land."

