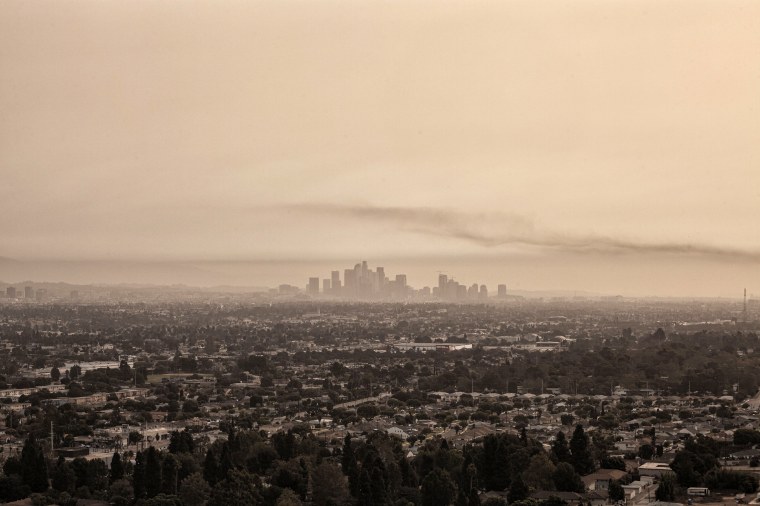
The World Health Organization has issued strict new standards for air pollution levels, and data suggests that the air in many regions across the United States contains much higher levels of dangerous matter than the standards recommend.
The WHO says air pollutants are responsible for more than 4 million premature deaths a year worldwide, calling it “one of the greatest environmental risks to health.”
But an NBC News analysis of air pollution levels shows that air quality across the country on average already falls short of the WHO's guidance, updated in September for the first time in more than 15 years.
While nationwide air quality is already worse than the new threshold, it’s especially bad in California, Oregon, Nevada, Idaho and Washington, where levels of particulate matter are more than twice the recommended limit. The new guidance lowers the threshold for particulate matter in the air, among several other pollutants, cutting the recommended maximum amounts by half.
This form of particulate matter is a mix of microscopic solids and liquid droplets known as PM2.5, named for its size of 2.5 micrometers in diameter, or roughly one-thirtieth the width of human hair. Commonly found in wildfire smoke and vehicle exhaust, the pollutant has been connected to respiratory-related hospital admissions and increased mortality.
PM2.5 levels vary by region across the United States, but the national average in 2020 was about 8 micrograms per cubic meter, down from 13 in 2000, according to the Environmental Protection Agency. The WHO’s new guidelines set the recommended level at 5.
In the EPA’s Western region, California and Nevada averaged 11.7 micrograms last year. The agency’s region made up of Washington, Oregon and Idaho averaged 11.9 micrograms.
“When you inhale these particles, they are able to penetrate deeper into your respiratory system than larger particles,” said Michael Kleeman, a professor of civil and environmental engineering at the University of California, Davis. “Once there, the small particles kick off a cascade of biochemical processes that cause inflammation.”
He said high levels of PM2.5 in smoke are linked to adverse health effects and once the particles enter through the lungs, they can also cross over into the bloodstream and even organs.
The U.S. standards, last updated in 2012, are slightly less strict than the WHO’s current – and former – guidance, but the EPA said comparing the two standards is not so straightforward.
“Direct comparisons of [EPA] standards with the WHO guidelines are difficult and often impractical,” Tim Carroll, deputy press secretary for the EPA, wrote in an emailed statement to NBC News, adding that there were differences in which pollutants were measured and the way the data was averaged.
According to him, this sets the EPA apart from the WHO guidelines, which as the world body notes, are not “legally binding standards,” but a tool for member states.
Kleeman said the U.S. standards are based on studies that compare populations from areas with different pollution levels, and observe the likelihood of dying earlier. He said the WHO is relying on new types of studies that use satellite data to estimate pollutant exposure for millions and millions of people.
“What they're seeing is that there's still health effects below the current U.S. standard,” he said.
According to an analysis of EPA data, the average U.S. pollutant levels have continued to decline since at least 2000.
That number changes when looking at the regional data, which shows the western U.S. with levels barely below the EPA’s standard, while the rest of the country is in a safer range.
And while wildfires turned the sky orange in California, that smoke can carry over to parts of the East Coast, affecting the air quality nearly 3,000 miles away.
Despite that, Kleeman said the air quality in the U.S. is far better than it was decades ago.
“Comparing Los Angeles in the 1970s to now, it's just way, way better. That's been the result of things like catalytic converters, improved vehicle technology, and controls on factories,” he said.
Kleeman said that PM2.5 levels in the 1970s could range as high as 50 micrograms per cubic meter in California. According to the EPA, these levels haven’t become much higher than 20 micrograms in the previous 20 years.
That decline was largely attributed to the Clean Air Act of 1970, a series of laws that paved the way for air quality standards in the U.S.
“The U.S. does not adjust our standards according to the WHO guidelines. The Clean Air Act requires EPA to periodically review the science upon which U.S. standards are based and the standards themselves.”
EPA Administrator Michael Regan said last summer the agency is reconsidering a Trump administration decision to keep the existing air quality standards, but that the review process is expected to last until spring 2023.
Kleeman said that the big and obvious sources of air quality have already been accounted for, and that the low-level improvements present challenges.
“It's difficult to achieve low, continued improvement in the air quality without really revolutionizing the energy system.”
