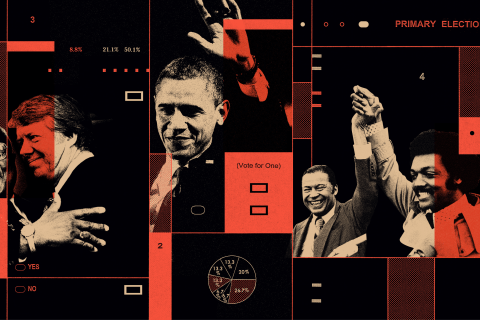
New Jersey Governor
e
99%
IN


Projected Winner
Exit polls
| VOTER CHARACTERISTICS/ATTITUDES | Leader | Murphy |
Guadagno |
||
|---|---|---|---|---|---|
| Gender | Male 47% | 56 | 41 | ||
| Female 53% | 55 | 43 | |||
| Age | 18-29 11% | 73 | 25 | ||
| 30-44 21% | 63 | 34 | |||
| 45-64 45% | 54 | 44 | |||
| 65 or over 24% | 44 | 55 | |||
| Age | 18-44 31% | 66 | 30 | ||
| 45 or over 69% | 51 | 48 | |||
| Age | 18-64 76% | 59 | 39 | ||
| 65 or over 24% | 44 | 55 | |||
| Race | White 72% | 45 | 53 | ||
| Black 10% | 94 | 4 | |||
| Hispanic/Latino 13% | 82 | 17 | |||
| Asian 3% | - | - | |||
| Other 2% | - | - | |||
| Gender by race | White men 34% | 46 | 50 | ||
| White women 39% | 44 | 55 | |||
| Black men 5% | - | - | |||
| Black women 5% | 94 | 4 | |||
| Latino men 6% | 74 | 25 | |||
| Latino women 7% | 88 | 11 | |||
| All others 5% | 65 | 32 | |||
| Education: College degree | College graduate 58% | 57 | 41 | ||
| No college degree 42% | 54 | 44 | |||
| Education: High school diploma | More than high school graduate 84% | 56 | 42 | ||
| High school graduate or less 16% | 55 | 44 | |||
| Education by race | White college graduates 44% | 50 | 48 | ||
| White no college degree 28% | 38 | 60 | |||
| Non-white college graduates 14% | 80 | 18 | |||
| Non-white no college degree 14% | 86 | 13 | |||
| Education by gender among whites | White women college graduates 23% | 51 | 49 | ||
| White women no college degree 15% | 35 | 63 | |||
| White men college graduates 20% | 50 | 47 | |||
| White men no college degree 13% | 41 | 56 | |||
| All others 28% | 83 | 15 | |||
| Income | Under $30,000 9% | 80 | 17 | ||
| $30,000 - $49,999 14% | 67 | 31 | |||
| $50,000 - $99,999 27% | 55 | 42 | |||
| $100,000 - $199,999 36% | 50 | 49 | |||
| $200,000 or more 15% | 52 | 48 | |||
| Income | Under $50,000 23% | 72 | 26 | ||
| $50,000-$99,999 27% | 55 | 42 | |||
| $100,000 or more 50% | 50 | 49 | |||
| No matter how you voted today, do you usually think of yourself as a: | Democrat 43% | 93 | 6 | ||
| Republican 29% | 7 | 92 | |||
| Independent or something else 28% | 50 | 46 | |||
| Party by gender | Democratic men 19% | 96 | 3 | ||
| Democratic women 24% | 91 | 8 | |||
| Republican men 13% | 7 | 92 | |||
| Republican women 16% | 8 | 92 | |||
| Independent men 16% | 50 | 44 | |||
| Independent women 13% | 49 | 48 | |||
| Ideology | Liberal 32% | 94 | 4 | ||
| Moderate 46% | 50 | 49 | |||
| Conservative 22% | 14 | 84 | |||
| Does anyone in your household belong to a labor union? | Yes 30% | 64 | 35 | ||
| No 70% | 53 | 45 | |||
| When did you finally decide for whom to vote in the election for governor? | In the last few days 15% | 52 | 45 | ||
| In the last week 13% | 49 | 47 | |||
| In October 15% | 56 | 42 | |||
| Before that 56% | 58 | 41 | |||
| When did you finally decide for whom to vote in the election for governor? | In the last week 29% | 51 | 46 | ||
| Before that 71% | 58 | 41 | |||
| When did you finally decide for whom to vote in the election for governor? | October/November 44% | 53 | 45 | ||
| Before that 56% | 58 | 41 | |||
| Which one of these four issues mattered most in deciding how you voted for governor today? | Corruption in government 34% | 68 | 30 | ||
| Health care 19% | 86 | 12 | |||
| Immigration 10% | 42 | 58 | |||
| Property taxes 29% | 31 | 68 | |||
| How do you feel about the way Donald Trump is handling his job as president? | Strongly approve 18% | 9 | 91 | ||
| Somewhat approve 17% | 16 | 82 | |||
| Somewhat disapprove 9% | 47 | 50 | |||
| Strongly disapprove 54% | 88 | 10 | |||
| How do you feel about the way Donald Trump is handling his job as president? | Approve 36% | 12 | 87 | ||
| Disapprove 63% | 82 | 16 | |||
| Was one reason for your vote for governor today: | To express support for Donald Trump 11% | 11 | 89 | ||
| To express opposition to Donald Trump 28% | 96 | 3 | |||
| Donald Trump was not a factor 59% | 46 | 52 | |||
| Is your opinion of the Democratic Party: | Favorable 52% | 92 | 8 | ||
| Unfavorable 45% | 16 | 81 | |||
| Is your opinion of the Republican Party: | Favorable 35% | 13 | 86 | ||
| Unfavorable 61% | 80 | 17 | |||
| How do you feel about the way Chris Christie is handling his job as governor? | Strongly approve 4% | - | - | ||
| Somewhat approve 18% | 18 | 82 | |||
| Somewhat disapprove 26% | 39 | 59 | |||
| Strongly disapprove 52% | 81 | 17 | |||
| How do you feel about the way Chris Christie is handling his job as governor? | Approve 22% | 19 | 80 | ||
| Disapprove 77% | 67 | 31 | |||
| Is New Jersey's economy: | Getting better 15% | 35 | 64 | ||
| Getting worse 38% | 63 | 35 | |||
| Staying about the same 45% | 58 | 40 | |||
| Does Phil Murphy's work at Goldman Sachs make you think: | Better of him 8% | 85 | 14 | ||
| Worse of him 29% | 37 | 60 | |||
| Have no effect 59% | 63 | 36 | |||
| Do Kim Guadagno's ties to Chris Christie make you think: | Better of her 4% | - | - | ||
| Worse of her 49% | 87 | 11 | |||
| Have no effect 44% | 26 | 72 | |||
| Is your opinion of Cory Booker: | Favorable 55% | 81 | 18 | ||
| Unfavorable 37% | 23 | 75 | |||
| Is your opinion of Bob Menendez: | Favorable 31% | 86 | 13 | ||
| Unfavorable 57% | 39 | 59 | |||
| Region | Urban North 19% | 76 | 22 | ||
| Suburban North 15% | 59 | 39 | |||
| Northwest 17% | 43 | 55 | |||
| Central 20% | 53 | 45 | |||
| South 29% | 50 | 47 | |||