2020 primary Elections South Carolina results
South Carolina, which has the highest proportion of African American voters among the four early voting states, is seen as a strong indicator of how well the candidates are performing with the key Democratic constituency. Fifty-four pledged delegates are at stake.
South Carolina Republicans canceled their primary this year.
Presidential primary results
Democrats / 54 Delegates
100% in
The following is a summary of South Carolina's Democratic Primary. South Carolina has 54 delegates and 63 available delegates including supers.
- Democrat
Joe BidenWinner
48.6%
262,336
+ 39 Delegates
- Democrat
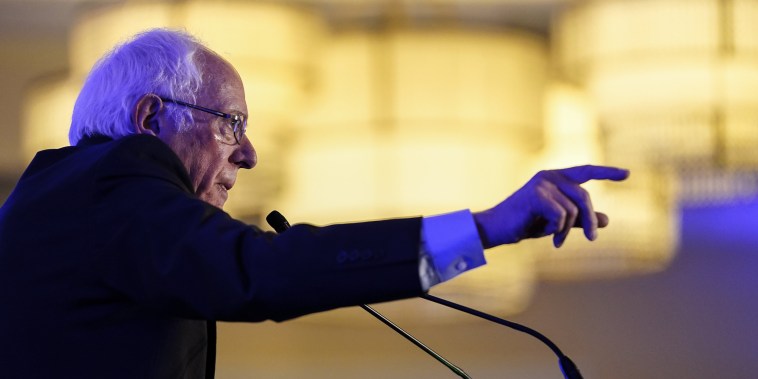
Bernie SandersWinner
19.8%
106,605
+ 15 Delegates
- Democrat
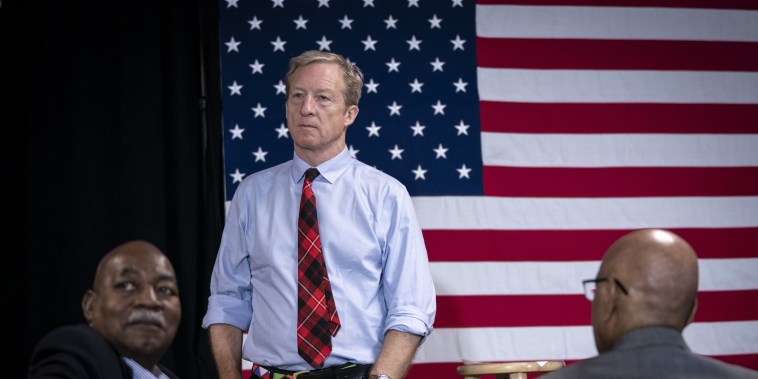
Tom SteyerWinner
11.3%
61,140
- Democrat
Pete ButtigiegWinner
8.2%
44,217
- Democrat
Elizabeth WarrenWinner
7.1%
38,120
- Democrat
Amy KlobucharWinner
3.1%
16,900
- Democrat
Tulsi GabbardWinner
1.3%
6,813
- Democrat
Andrew YangWinner
0.2%
1,069
- Democrat
Michael BennetWinner
0.1%
765
- Democrat
Cory BookerWinner
0.1%
658
- Democrat
John DelaneyWinner
0.1%
352
- Democrat
Deval PatrickWinner
0.1%
288
Presidential exit polls
Exit polls are surveys of voters conducted as they leave (or exit) their polling place on Election Day. The survey asks who voters decided to vote for and includes questions to help explain voter attitudes and demographics.
Polls close at -12:00 P.M. ET, March 1. Come back for results.
Democrats
Updated on Feb. 29 2020, 10:47PM ET
- Biden
- Buttigieg
- Gabbard
- Klobuchar
- Sanders
- Steyer
- Warren
Gender
Race
Race
Age
Age
Age by race
Which best describes your education? You have:
What was the last grade of school you completed?
Education by race
Education by white by sex
No matter how you voted today, do you usually think of yourself as a:
On most political matters, do you consider yourself:
On most political matters, do you consider yourself:
On most political matters, do you consider yourself:
Are you gay, lesbian, bisexual or transgender?
Have you ever served in the U.S. military?
How often do you attend religious services?
How often do you attend religious services?
Before today, had you ever voted in a Democratic presidential primary?
Which ONE of these four issues mattered most in deciding how you voted today?
Which ONE of these four candidate qualities mattered most in deciding how you voted today?
If you had to choose, would you rather see the Democratic Party nominate a candidate who:
How do you feel about replacing all private health insurance with a single government plan for everyone?
Do you think the economic system in the United States:
Do you think the next president should:
Which comes closest to your feelings about the Trump administration:
Which ONE of these candidates best understands the concerns of racial and ethnic minorities?
In the election for president this November, will you vote for the Democratic nominee regardless of who it is?
Is your opinion of Joe Biden:
Is your opinion of Michael Bloomberg:
Is your opinion of Pete Buttigieg:
Is your opinion of Amy Klobuchar:
Is your opinion of Bernie Sanders:
Is your opinion of Tom Steyer:
Is your opinion of Elizabeth Warren:
When did you finally decide for whom to vote in the presidential primary?
Time of decision
Time of decision
In your vote in today's presidential primary, how would you rate the importance of Rep. Clyburn's endorsement?
In your vote in today's presidential primary, how would you rate the importance of Rep. Clyburn's endorsement?
In your vote in today's presidential primary, how would you rate the importance of Rep. Clyburn's endorsement?
Area
Region
More 2020 coverage