Don't fixate on a hurricane forecast's skinny black line — it could cost you your life. The National Hurricane Center issues that warning every time a storm bears down on the Atlantic or Gulf coasts.
Even if the line predicts perfectly the hurricane eye's path — something it rarely does — many forget that a storm's devastating winds can spread out dozens of miles in all directions.
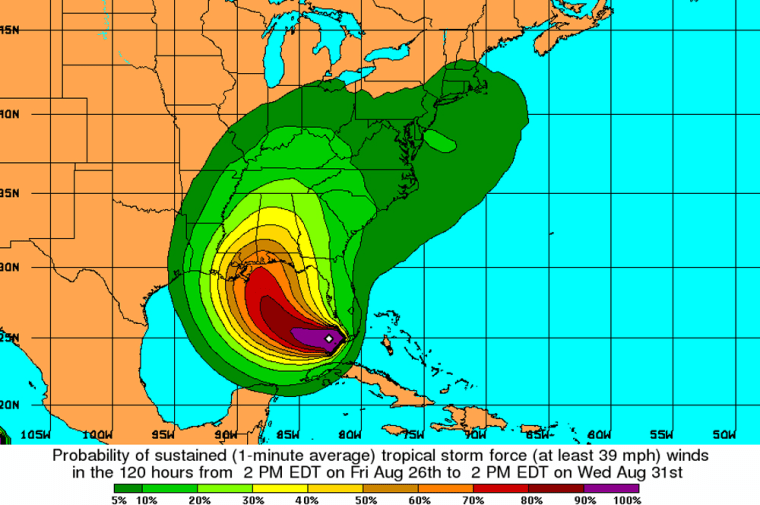
To overcome the public's obsession with the line, the hurricane center this year is adding a graphic that will list the probability that tropical storm or hurricane-force winds will threaten a specific area over a period of time, such as a 24-hour period. Tested for two years, the graphic gives residents a clearer picture of if and when they could experience storm-force winds and help them make important decisions, such as whether to evacuate, the center says.
"There's some value in being able to tell somebody that there's a 20 percent chance of being hit by a hurricane ... or a 10 percent chance of having hurricane force winds," center Director Max Mayfield said. "That will really be useful for a lot of people."
TV weather forecasters, emergency managers and the public will have access to the full-color graphic, a series of ovals growing out from the storm's center. The ovals closest to the center shows the highest probability for storm-force winds within a certain time period, and the probabilities get smaller with each bigger ovals surrounding the center.
Charley, Wilma confusion
Richard Pasch, a specialist at the hurricane center, points to two past storms where the skinny black line may have caused confusion: 2004's Charley and last year's Wilma.
During Charley, victims in Punta Gorda or Port Charlotte who were caught by surprise may have been playing too much attention to the line — which showed the storm's center heading to the Tampa area — and not the "cone of uncertainty." It clearly included both southwest Florida cities in the margin of error, but many claimed later they hadn't been warned.
And during Wilma, Miami-Dade and Broward county residents focused on the line heading inland through Naples may not have accounted for the storm's breadth, thinking that they may be safer because the center was to the north.
"Wilma was an example where size was the real issue," Pasch said. "Wilma was very large and the eye wall covered a large part of South Florida."
State meteorologist Ben Nelson raved about the new graphic, saying he will use it this season to help make decisions about evacuations and mobilizing emergency materials.
"Most of our actions at emergency management in terms of evacuations ... are all predicated on the arrival of tropical storm force winds," Nelson said. "It's going to be an excellent planning tool."
