In 2018, it’s commonplace to say that the Democratic and Republican parties represent two different Americas. But a new set of data this week shows some of the most significant gaps between the two major parties are growing wider.
The study of political partisanship from the Pew Research Center compares registered voters who self-identified as Republicans and Democrats in 1997 and 2017 and finds both are being affected by changes in the nation overall, but at very different rates. The net effect is that the two parties are in some ways headed in very different directions, demographically and culturally.
Take racial and ethnic diversity as a measure.
Of course, the data show the United States has grown more diverse since 1997. Among all voters in the Pew data, the percentage of white, non-Hispanic registered voters has dropped 14 points, to 69 percent in 2017 from 83 percent in 1997. But the numbers look very different for Democrats and Republicans.

The GOP has seen a smaller 9-point decline in the share of its voters who are white and non-Hispanic to 83 percent in 2017 from 92 percent in 1997. But the Democrats have seen a much steeper 16-point decline in the share of its voters who are white, to 59 percent from 75 percent in 1997.
As a result, the divide between the parties on the percentage of members who are white is wider now than it was then.
Age is another marker. The Pew data show the country is graying. In 2017, 50 percent of the registered voters their surveyed were older than 50. That number was up 10 points from 1997 when the figure was 40 percent. But the data show the Republicans are graying much faster than the Democrats.

In 2017, 57 percent of Republicans were age 50 or older, that age group made up only 39 percent of the party in 1997, an increase of 16 points. Democrats have gotten grayer as well, but only by 5 percentage points — 47 percent now, versus 42 percent 20 years ago.
The partisan changes in college education rates are breathtaking. On the whole, more U.S. voters in the Pew data have a college degree than 20 years ago. The figure was 33 percent in 2017, up 8 points from 1997, when the number was 25 percent. But at the party level, the shift has been one-sided.

Among self-identified Democrats, the number of college-educated voters has climbed 15 points, to 39 percent, since 1997. But among Republicans, the number of college-educated voters is unchanged at 28 percent. This is a big shift. In 1997, Republicans were more likely to hold a college degree than Democrats. The figures are now reversed.
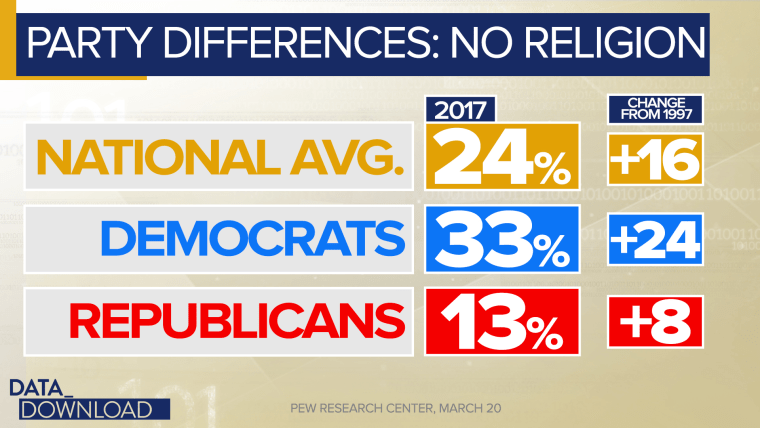
And on the often contentious issue of religion, the parties are moving further apart. In national terms, the percentage of registered voters with no religious affiliation is growing while the share of white evangelical Christians declines.
Again, this is true at the party level as well, but the rates of change are dramatically different.

The percentage of Democrats with no religious affiliation climbed 24 points between 1997 and 2017. A third of Democrats, 33 percent, now claim no religious affiliation. With Republicans the increase was only 8 points. Only 13 percent of Republicans claim no religious affiliation today.
With white evangelical Christians, the differences are reversed.
The percentage of Republican voters who are white evangelical Christians has declined ever so slightly since 1997, only 1 point to 33 percent. But among Democrats the white evangelical Christian drop has been much steeper, a 12-point drop to just 7 percent of all party voters.
In sum, the United States has changed a lot in the last 20 years and the nation’s two major political parties haven’t been immune to those changes. But the different rates of change among the Democrats and Republicans mean that the parties are, in many ways, growing ever further apart.
On all the measures listed here, the Democrats and Republicans look less similar than they did 20 years ago, even as the two parties are generally moving in the same direction.
And, to be clear, this is not merely an exercise in bean counting. The splits outlined here — race, age, education, religious adherence — are tied to deeper cultural and socio-economic differences that consistently appear in policy debates on a range of topics.
In that way, these numbers are not just a tallying of party differences, they are numeric evidence for why compromise has become so scarce in Washington, and why it is only growing harder to find.