WASHINGTON — This year marks the 30th anniversary of the NBC News/Wall Street Journal poll, and a lot has changed since its initial debut in September of 1989.
The numbers show a country that has grown more dour and partisan in the last 30 years, but also one that has seen some dramatic cultural shifts.
Presidential job approval, then and now, offers one example of how much things have changed.
Throughout his time in office, President Donald Trump has had a remarkably consistent approval number. From February 2017 to October of this year, he’s bounced between 39 and 47 percent approval. But underneath those figures, the partisan split has been remarkable.
Consider October, the latest poll, in which his job approval number overall was a mediocre 45 percent. But among Republicans, it was a stratospheric 91 percent, compared to an abysmal 6 percent approval among Democrats.
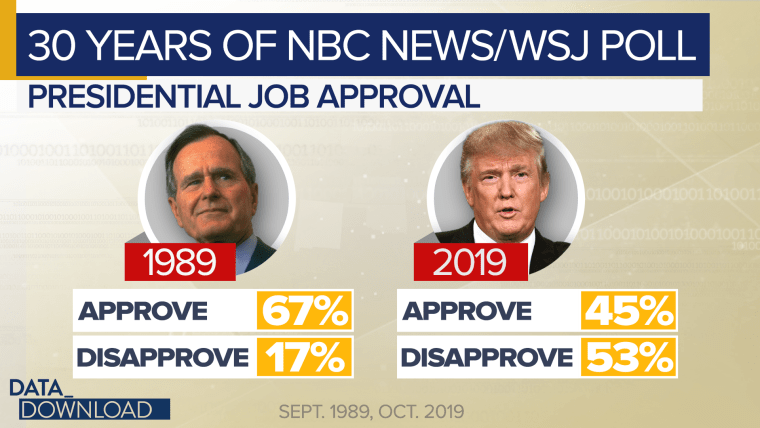
The picture was very different 30 years ago. In the very first NBC/WSJ poll, in September 1989, President George H. W. Bush had a very solid approval number of 67 percent. That figure would be outstanding today. But even more remarkable, the partisan splits were much more muted. Bush had a very high job approval number among Republicans, 89 percent, but he also did well among Democrats — 53 percent of them approved.
And remember, that was September 1989, before the first Gulf War or the collapse of the Berlin Wall. It was Bush’s post-honeymoon resting approval rating. Those figures seem hard to believe today.
Beyond politics, however, the poll numbers from then and now show a country that has turned less sunny about the future in general. On the question of whether the children of today will be better off than their parents, there’s been a noticeable decline.
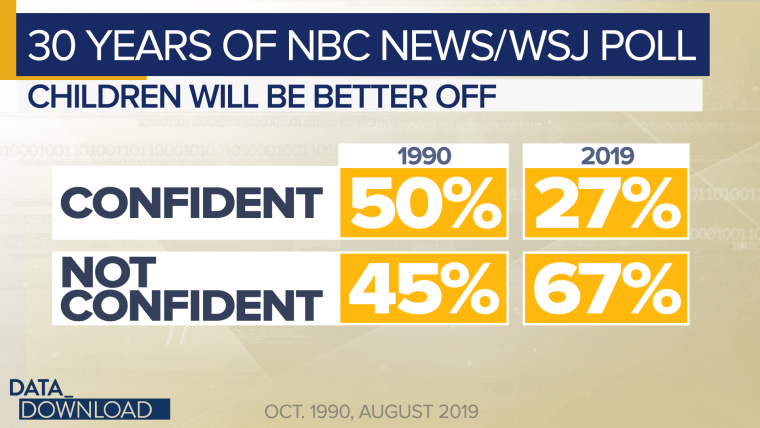
Back in 1990, the country was fairly divided over the prospects of the next generation. Half of those surveyed, 50 percent, said they felt confident the next group of Americans would have a better life than their parents — 45 percent said they did not feel confident about that. Still, a 5-point edge for the optimists.
When the poll asked the same question in 2019, only 27 percent said they felt confident about the next generation’s prospects, while a whopping 67 percent said they did not feel confident. The pessimists ruled by 40 points.
There’s been a lot of economic change in the years between those polls, of course, and the numbers suggest most Americans did not think it was for the best. Numbers like those help explain some of the populist energy in the United States today.
And away from the economy, the poll shows some broader cultural shifts in the United States.
For instance, there has been a lot of growth in support for working mothers.
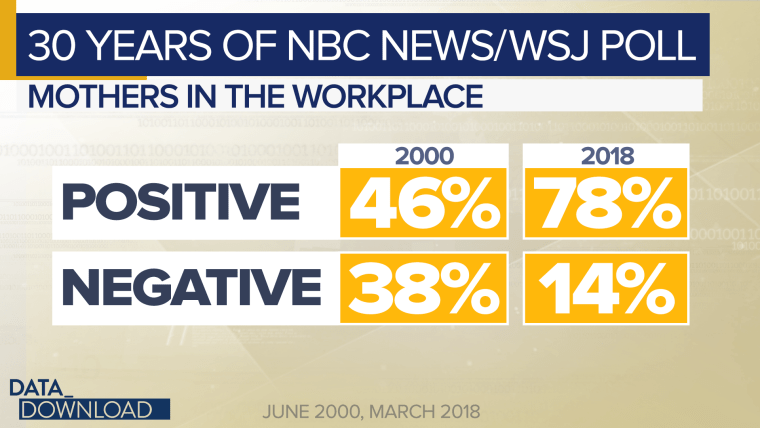
Back in 2000, 46 percent of those polled said they believed it was a positive development that women were pursuing a career while they were raising children. But 38 percent believed that was a negative development. That’s a narrow six-point edge favoring working mothers.
By 2018, 78 percent of those surveyed said the rise of working mothers was a positive development, while only 14 percent said it was negative. That’s a massive shift on an important everyday issue in just 18 years.
And there are other examples.
Support for same-sex marriage has climbed sharply in the last 20 years.
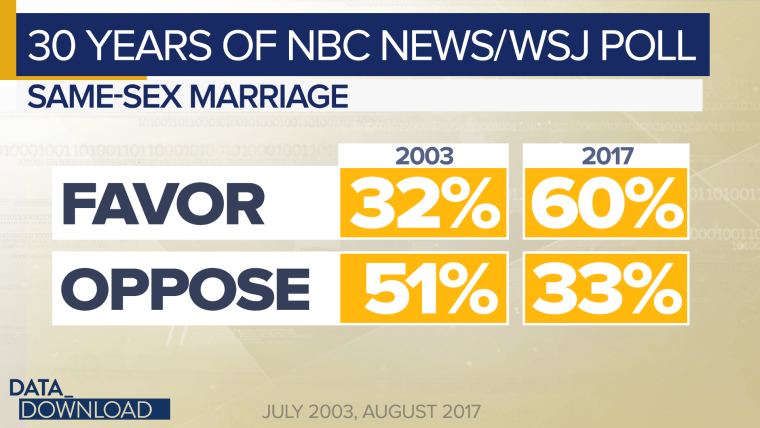
In 2003, only 32 percent of those surveyed said they favored same-sex marriages, while 51 percent said they opposed them — that’s a net 19-point edge for opponents.
In 2017, 60 percent of those surveyed said they favored the unions, while only 33 percent opposed them — a net 27-point advantage for those who favor same-sex marriage. That is a dramatic swing toward accepting gay marriage in just 14 years.
And the data show that the nation is becoming more secular — or at least acting more secular where church-going habits are concerned.
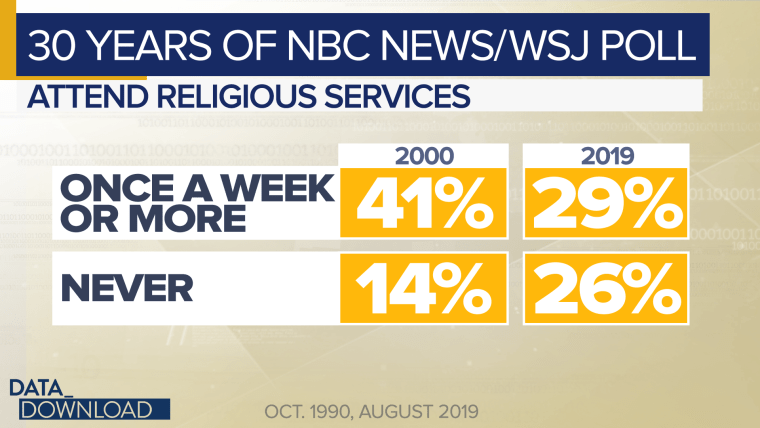
In 2000, 41 percent of those surveyed said they attended religious services once a week or more, while 14 percent reported that they never went — a spread of 27-point favoring churchgoers.
In 2019, the figures have gotten much closer. Today, 29 percent of Americans say they attend religious services once a week or more, while 26 percent say they never attend. That’s a narrow 3-point gap. Indeed, the rise of “nones,” those with no religious affiliation, has been one of the biggest trends noted by those who study religion in America.
The long-term trends here are more than just interesting, they reveal something bigger about Washington and the world outside of it.
While political gridlock has been the dominant story on Pennsylvania Avenue for years now, the numbers here show the country doesn’t need the Congress or the president to go through major changes in attitude and culture. In a fairly short amount of time, there have been dramatic shifts in the way we see the world and ourselves. And there’s no reason to expect them to suddenly slow down regardless of who is in the White House or the Capitol Building.