WASHINGTON — The country’s population grows every year, but the size of the U.S. House of Representatives doesn’t. And over time, that has had a big impact on how representation in Congress’ lower chamber works, prompting some lawmakers to wonder whether it’s time to grow the House — something that hasn’t happened for decades.
Under the law, the House is locked at a ceiling of 435 members.
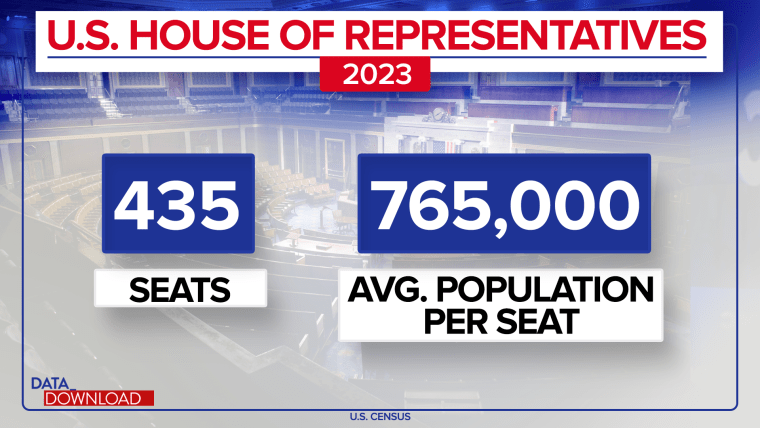
That may sound a lot of people, and most Americans are most likely unable to name even a dozen House members, but the U.S. is big country made up of more than 330 million people. When you do the math, that means the average House district represents something like 765,000 people.
That’s a big number: Several states don’t have that many residents, and it is a record for the size of House district.
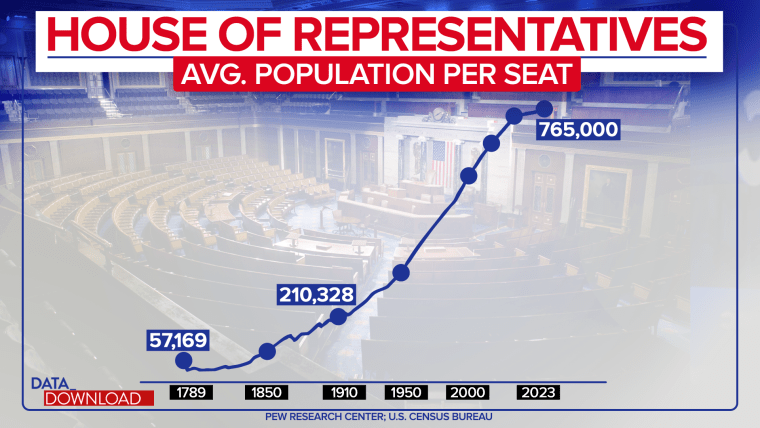
Back in 2010, the average district was home to about 710,000 people. In 2000, it was fewer than 650,000. That’s what happens when you cap the number of seats and the country keeps growing.
It wasn’t always this way. From 1790 to 1910, the House added seats to accommodate for population growth after every census. Redistricting was about adding seats to the chamber, as well as drawing new district lines.
But concerns about the House’s being too big and disputes between urban and rural areas (sound familiar?) led to a redistricting deadlock after the 1920 census. And in 1929, the number of seats was capped at 435.
The line above shows what happened then. The size of the average congressional district skyrocketed from 241,000 in 1920 to 344,000 in 1950 to 646,000 in 2000. That means the average House member is representing more than three times as many people than in 1920 — and that comes with serious impacts.
For starters, there's the question of how well a single person can represent a group of constituents that is larger than Seattle or Denver or Las Vegas — all big, diverse cities that are smaller than the average House district.
The U.S. is in a special category when you compare the average number of constituents per district in the House to the average numbers for the lower chambers of peer countries. A 2018 Pew Research Center analysis found that representatives in those countries served far smaller populations.
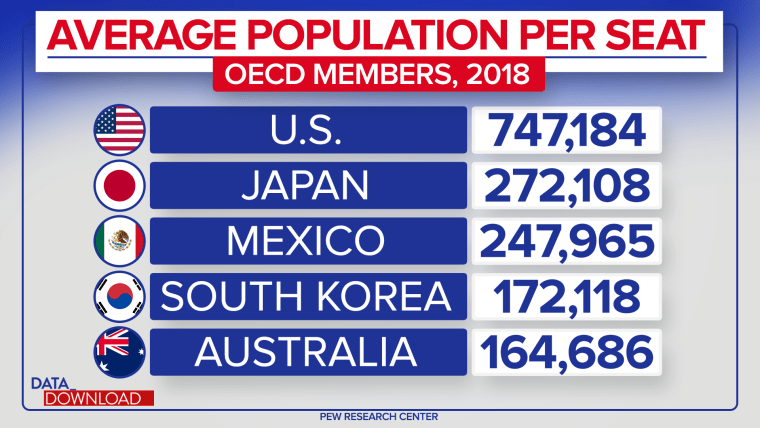
The analysis, which compared the countries in the Organization for Economic Cooperation and Development, found the next-largest representation ratio was in Japan’s lower chamber, where the number was about 272,000 people per representative. Mexico was at about 247,000 per representative. South Korea was at about 172,000 per representative. Australia was at 164,000.
The U.S. House figure of more than 765,000 is in a different league altogether.
As a proposed remedy, Rep. Earl Blumenauer, D-Ore., in January introduced H.R. 622, a bill that would grow the House to 585 seats after the next redistricting.
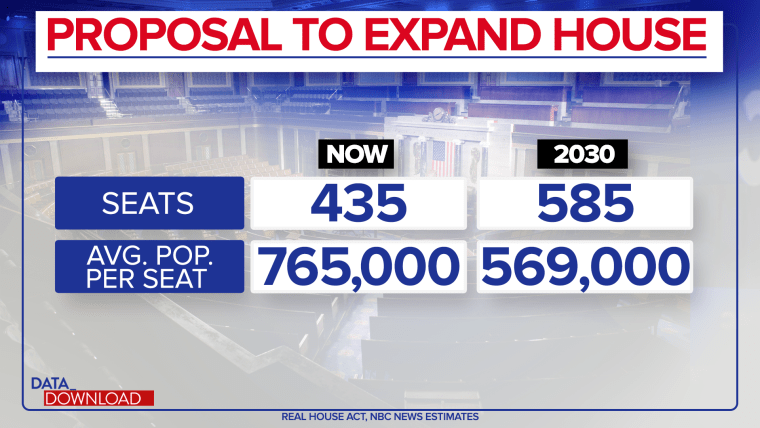
That would have a dramatic impact on just how many constituents are grouped into each congressional district. Going by current population figures, it would put the per-district average at about 569,000 people — roughly 200,000 fewer than today and close to the district average of 1990.
The bill hasn’t exactly lit the world on fire so far, having only two co-sponsors. And it’s not clear how the new, larger House would affect the formula for how seats are apportioned. But if the proposal were to become law, it could radically change what representation looks like — at least for some states.
There most likely would be some small changes among the six smallest states, which have only one representative.
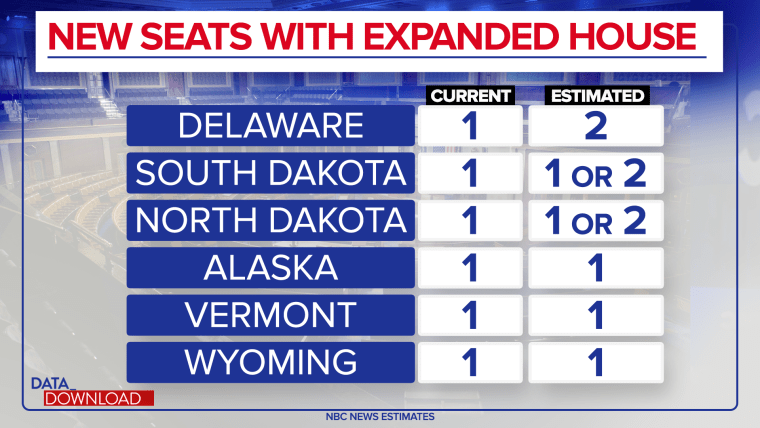
Again, no one knows exactly how new seats would be divvied up, but going just by averages, Delaware would probably grab another seat. North and South Dakota might get a new one. But Alaska, Vermont and Wyoming might be more likely to stick at one seat each. Those three states have populations of less than 765,000, which is the current House district average.
But at the other end of the population spectrum, the biggest states might be due for big additions — again, working off population averages.
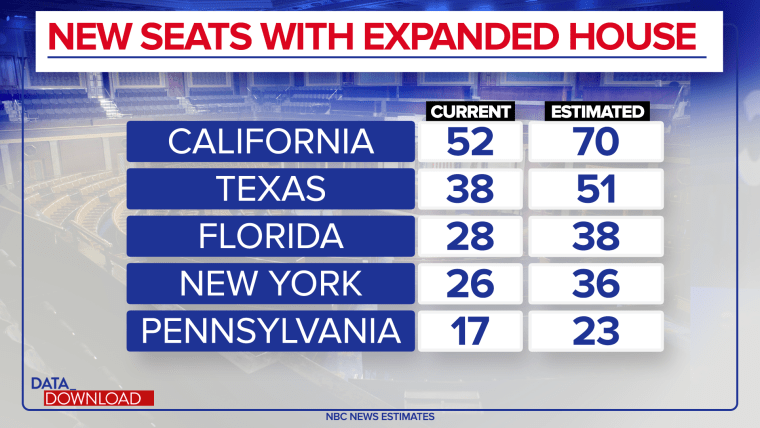
California, which has 52 House districts (far and away the most in the House) could jump to 70 seats, a gain of 18. Texas might go from 38 seats to 51. Florida could grow from 28 to 38. New York could jump 10 seats, as well, from 26 to 36. And Pennsylvania might climb from 17 to 23.
Those are rough estimations working off the 2020 population figures from the last apportionment. And, of course, the 2030 census is still years away. States can grow or shrink a lot in 10 years.
Partisans on the left or the right might look at those numbers and see neat narratives — "Eighteen more seats in Democratic California!" "Thirteen more seats in Republican Texas!" But more districts mean more lines and more ways to draw those lines in ways that favor one party or the other. The actual partisan impacts are harder to nail down.
But it’s easier to see impacts in terms of basic math. More districts would mean smaller districts, at least on average, and behind the proposal is a more fundamental question: At what point is a representative’s district too big to represent adequately?
The proposal to grow the House may not be getting a lot of attention, but as the average population per district edges closer to 1 million, the question may gain traction.