Early voting in Kentucky
Mail-in and early in-person votes cast253,018
Election Night Coverage
GOP starts boosting Walker in runoff amid calls to keep Trump away from Georgia
Nov. 9, 2022
Maricopa County officials apologize for Arizona ballot reader issue
Nov. 9, 2022
New Hampshire’s James Roesener is first trans man elected to a state legislature
Nov. 9, 2022
Here are the Black candidates who made history on election night
Nov. 9, 2022
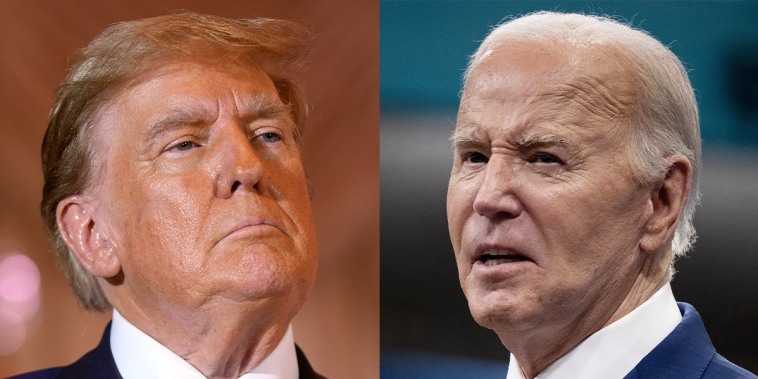
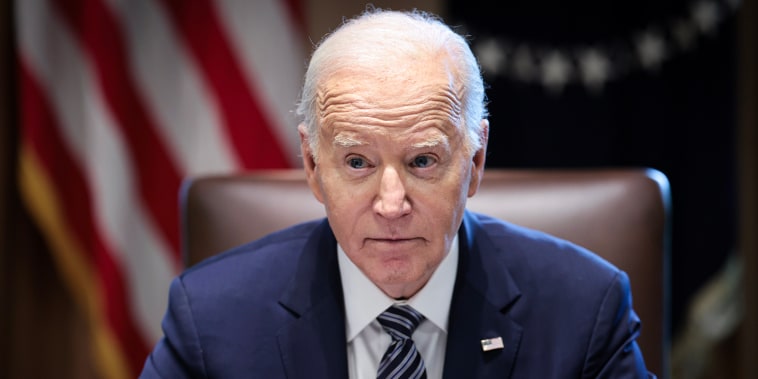
Biden speaks with McCarthy as House control remains too early to call
Nov. 9, 2022
‘So much relief’: South Dakota voters pass Medicaid expansion
Nov. 9, 2022
Counting in Nevada's Clark County continues after 56,900 mail ballots were received on Election Day
Nov. 9, 2022
Eric Sorensen becomes first LGBTQ person elected to Congress from Illinois
Nov. 9, 2022
Latino Republican voters are more progressive than white Republican voters on key issues, exit polls find
Nov. 9, 2022
Alaska Senate race headed to ranked choice runoff
Nov. 9, 2022
Schumer says Democrats are 'feeling good' about keeping majority after pundits 'missed it'
Nov. 9, 2022
Abortion rights advocates see a flurry of post-Roe victories in midterms
Nov. 9, 2022
More to the story: Inflation in the South
| State Name | Percent In | Candidates | Link to Page |
|---|
In poll after poll, inflation has dominated how Americans view the economy, emerging as a top concern in the lead up to the November 2022 midterms.
In poll after poll, inflation has dominated how Americans view the economy, emerging as a top concern in the lead up to the November 2022 midterms.
How prices have changed from last year
7.7%
South7.1%
USA| State Name | Percent In | Candidates | Link to Page |
|---|
Prices in the South, change from one year earlier
How Kentucky voted in past presidential elections
2020 Presidential Results
- RDonaldTrump62.1%
- DJoeBiden36.2%
2020 Exit Polls
Summary of 2020 Exit Poll data that shows the proportion of how different groups voted.
Men
Men: Democrats36%Men: republicans60%
Women
Women: Democrats36%Women: republicans63%
White
White: Democrats33%White: republicans66%
Black
Black: Democrats71%Black: republicans25%
Hispanic /Latino
Not enough data
Asian
Not enough data
College Graduate
College Graduate: Democrats45%College Graduate: republicans53%
No College degree
No College Degree: Democrats33%No College Degree: republicans65%
2016 Presidential Results
- RDonaldTrump62.5%
- DHillaryClinton32.7%
2016 Exit Polls
Summary of 2016 Exit Poll data that shows the proportion of how different groups voted.
Men
Men: Democrats26%Men: republicans71%
Women
Women: Democrats40%Women: republicans54%
White
White: Democrats27%White: republicans68%
Black
Not enough data
Hispanic /Latino
Not enough data
Asian
Not enough data
College Graduate
College Graduate: Democrats28%College Graduate: republicans67%
No College degree
No College Degree: Democrats31%No College Degree: republicans65%
MORE POLITICS COVERAGE


Election Night Coverage
GOP starts boosting Walker in runoff amid calls to keep Trump away from Georgia
Nov. 9, 2022
Maricopa County officials apologize for Arizona ballot reader issue
Nov. 9, 2022
New Hampshire’s James Roesener is first trans man elected to a state legislature
Nov. 9, 2022
Here are the Black candidates who made history on election night
Nov. 9, 2022
Biden speaks with McCarthy as House control remains too early to call
Nov. 9, 2022